
Statistical Modeling Services
SysMathx offers professional statistical modeling services that transform raw engineering and scientific data into interpretable relationships, reliable predictions, and quantified uncertainties. From sensor measurements and experimental logs to manufacturing records and field monitoring data, we build rigorous statistical models that capture underlying patterns while respecting the unique characteristics of physical systems. As part of our data-driven modeling suite, we also provide nonlinear system identification and network system modeling services for applications that require dynamic nonlinear behavior or interconnected system analysis.
Why Statistical Modeling for Engineering Data
Engineering data is rarely clean—it often includes noise, missing points, outliers, and intertwined dependencies that simple curve fitting cannot fully capture. Statistical modeling helps address these issues by explicitly describing variability and making uncertainty part of the analysis, rather than ignoring it. Compared with purely data-driven machine learning, it also keeps results more interpretable and closer to physical reasoning, which is especially important when decisions must be made with limited or high-impact data.
- Quantify uncertainty in predictions – Results are expressed with confidence ranges instead of single values, helping support risk-aware decisions.
- Separate signal from noise – Statistical structure helps identify underlying trends that may be hidden by measurement errors or fluctuations.
- Work with limited datasets – Prior information and regularization techniques help stabilize models when data is small or incomplete.
- Evaluate relationships more carefully – Helps distinguish meaningful physical associations from patterns that occur by chance.
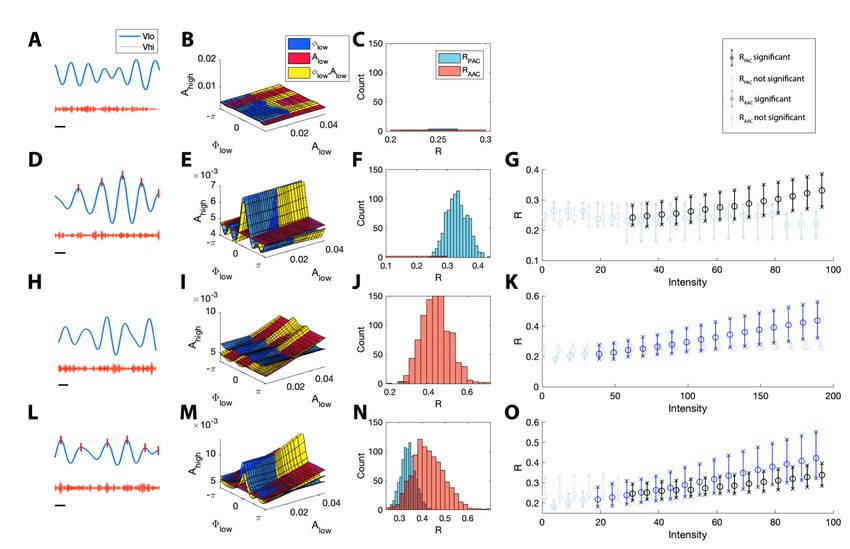 Fig.1 The statistical modeling framework successfully detects dierent types of cross-frequency coupling. (Nadalin J K, et al., 2019)
At SysMathx, we provide end-to-end statistical modeling solutions — from exploratory data analysis and distribution fitting to full-scale regression, time series modeling, and design of experiments. Each service is tailored to your measurement processes, data volume, and engineering objectives.
| Services | Capabilities |
|---|---|
|
Regression & Response Surface Modeling
|
For systems where the relationship between inputs and outputs is not deterministic or is obscured by noise, we build linear, generalized linear, and nonlinear regression models. These models quantify how each factor influences the response, identify significant interactions, and provide prediction intervals for new operating conditions.
|
|
Time Series Analysis & Forecasting
|
When data arrives sequentially—such as sensor streams, vibration signals, economic indicators, or degradation traces—we use time-dependent statistical models to capture autocorrelation, trends, seasonality, and random disturbances. These methods support real-time monitoring, anomaly detection, and future state prediction.
|
|
Uncertainty Quantification & Error Propagation
|
Every measurement and model parameter carries uncertainty. We quantify these uncertainties at the source and propagate them through the full analysis workflow—whether the goal is confidence intervals for derived quantities, tolerance bounds for manufacturing, or risk estimates for safety-critical decisions.
|
|
Design of Experiments and Data Collection Planning
|
Before any data is collected, the experimental design defines what can be learned from it. We help plan efficient, statistically sound experiments that maximize information gain while reducing the number of runs—especially important for costly physical testing or time-intensive simulations.
|
Statistical Modeling Methods and Tools
At SysMathx, our approach combines solid statistical principles with practical computational methods, ensuring models are reliable, interpretable, and usable in real engineering workflows. We avoid treating modeling as a black box—assumptions are made explicit, and results are always supported by diagnostic checks.
Applications of Statistical Modeling Services
Statistical modeling is applied wherever engineering data requires rigorous interpretation, from manufacturing and structural monitoring to environmental systems and experimental development. These applications demonstrate how complex datasets can be transformed into actionable insights for engineering decision-making.
Manufacturing Process Capability Analysis
Dimensional data from production runs is analyzed by fitting statistical distributions to key features. This enables assessment of process capability, identification of potential out-of-spec risks, and adjustment of tolerances before quality issues arise.
Vibration-Based Structural Health Monitoring
Vibration signals from sensors are transformed into statistical features such as variability and frequency characteristics. Time-based modeling helps distinguish normal operating conditions from early-stage mechanical wear.
Wind Farm Power Curve Validation
Operational data is used to establish relationships between wind conditions and turbine output through regression-based modeling. This supports performance evaluation under variable conditions and detection of efficiency degradation.
Pharmaceutical Batch Process Consistency
Sensor data across multiple production batches is evaluated using multivariate statistical monitoring methods. This allows early identification of abnormal patterns that may indicate process instability.
Automotive Engine Calibration Optimization
Engine control parameters are explored through structured experimental designs, and response models are built for key performance indicators. This enables balanced optimization across power, efficiency, and emission targets.
Environmental Monitoring Of Groundwater Contamination
Spatial and temporal measurement data is analyzed to model contaminant distribution across regions. The resulting uncertainty-aware maps support sampling strategy design and remediation planning.
Why Choose Our Statistical Modeling Services?
- Engineering Context First - Statistical modeling is always interpreted within the physical system rather than treated as a generic method. This ensures results remain meaningful for real engineering decisions.
- Rigorous Uncertainty Handling - Uncertainty is quantified through confidence ranges, prediction bands, and error propagation. These outputs are treated as essential parts of the final results.
- Small Data Capability - Methods remain reliable even when only limited experimental data is available. This is important in cases where data collection is costly or constrained.
- Transparent Model Diagnostics - Model assumptions are checked using standard diagnostic tools such as residual and distribution checks. This supports clear and verifiable results.
- Practical Implementation Support - Deliverables include usable workflows, code, and visual outputs for direct application. Documentation is prepared for easy integration into engineering practice.
- Experimental Design Support - Data collection is planned before experiments to maximize information from each run. This helps reduce unnecessary testing while improving efficiency.
Start Your Statistical Modeling Project Today!
Have engineering data that needs interpretation — but uncertain about the right statistical approach? Let's help you extract reliable insights, quantify uncertainty, and make data-driven decisions with confidence. Contact us with a description of your data and objectives, and our statistical modeling team will propose a tailored analysis plan.
FAQs
What sample size is needed for reliable statistical modeling?
It depends on the complexity and effect sizes. For simple regression, 10–15 samples per predictor may suffice; for time series with seasonality, 4–5 cycles are often recommended. We can perform power analysis to determine required sample sizes before data collection.
Can you handle data with missing values or outliers?
Yes. We use multiple imputation, expectation-maximization (EM), or model-based methods for missing data, and robust statistical techniques (e.g., M-estimators) that reduce the influence of outliers without arbitrarily deleting them.
Do you only work with clean, experimental data?
Not at all. We routinely handle industrial data with irregular sampling, sensor drift, censored values (below detection limits), and correlated noise. Our methods are chosen to be robust to real-world imperfections.
What is the difference between your statistical modeling and typical machine learning?
Statistical modeling emphasizes interpretability, uncertainty quantification, and smaller sample efficiency. We can tell you which factors are significant, how confident you should be, and why the model makes a given prediction — essential for engineering approvals and regulatory submissions.
Can you integrate statistical models with existing physics-based simulations?
Yes. We often build statistical surrogates (emulators) of expensive simulations, or use statistical models to calibrate physics-based parameters against experimental data. This hybrid approach is a core strength.
Reference
- Nadalin J K, et al. A statistical framework to assess cross-frequency coupling while accounting for confounding analysis effects. Elife. 2019, 8: e44287.